
Steve Bottos
Lead Machine Learning Engineer | Victoria, BC
A First Pass at "Find-and-Interpret"
| Artifacts | |
|---|---|
| Model | stevebottos/qwen3.5-0.8b-find-and-interpret |
| Code | stevebottos/find-and-interpret |
In my last post I talked a little bit about the issues with a few popular RAG approaches. I settled on a two key points to keep in mind:
- if you’re working with documents, you should consider visual-RAG
- while a visual-RAG system is simpler (at least in my opinion) architecturally than hybrid-RAG when documents are oddly laid out and rich in visual context, the trade-off is token inefficiency and context inefficiency at generation time.
For this post, we’ll be more focused on the generation part, which falls more under the domain of Visual Question Answering (VQA). In standard VQA, you would usually start with a query, retrieve pages that are likely relevant to that query, and then send each full page in context + the query downstream to whatever model you’re using to synthesize answers, something like this:
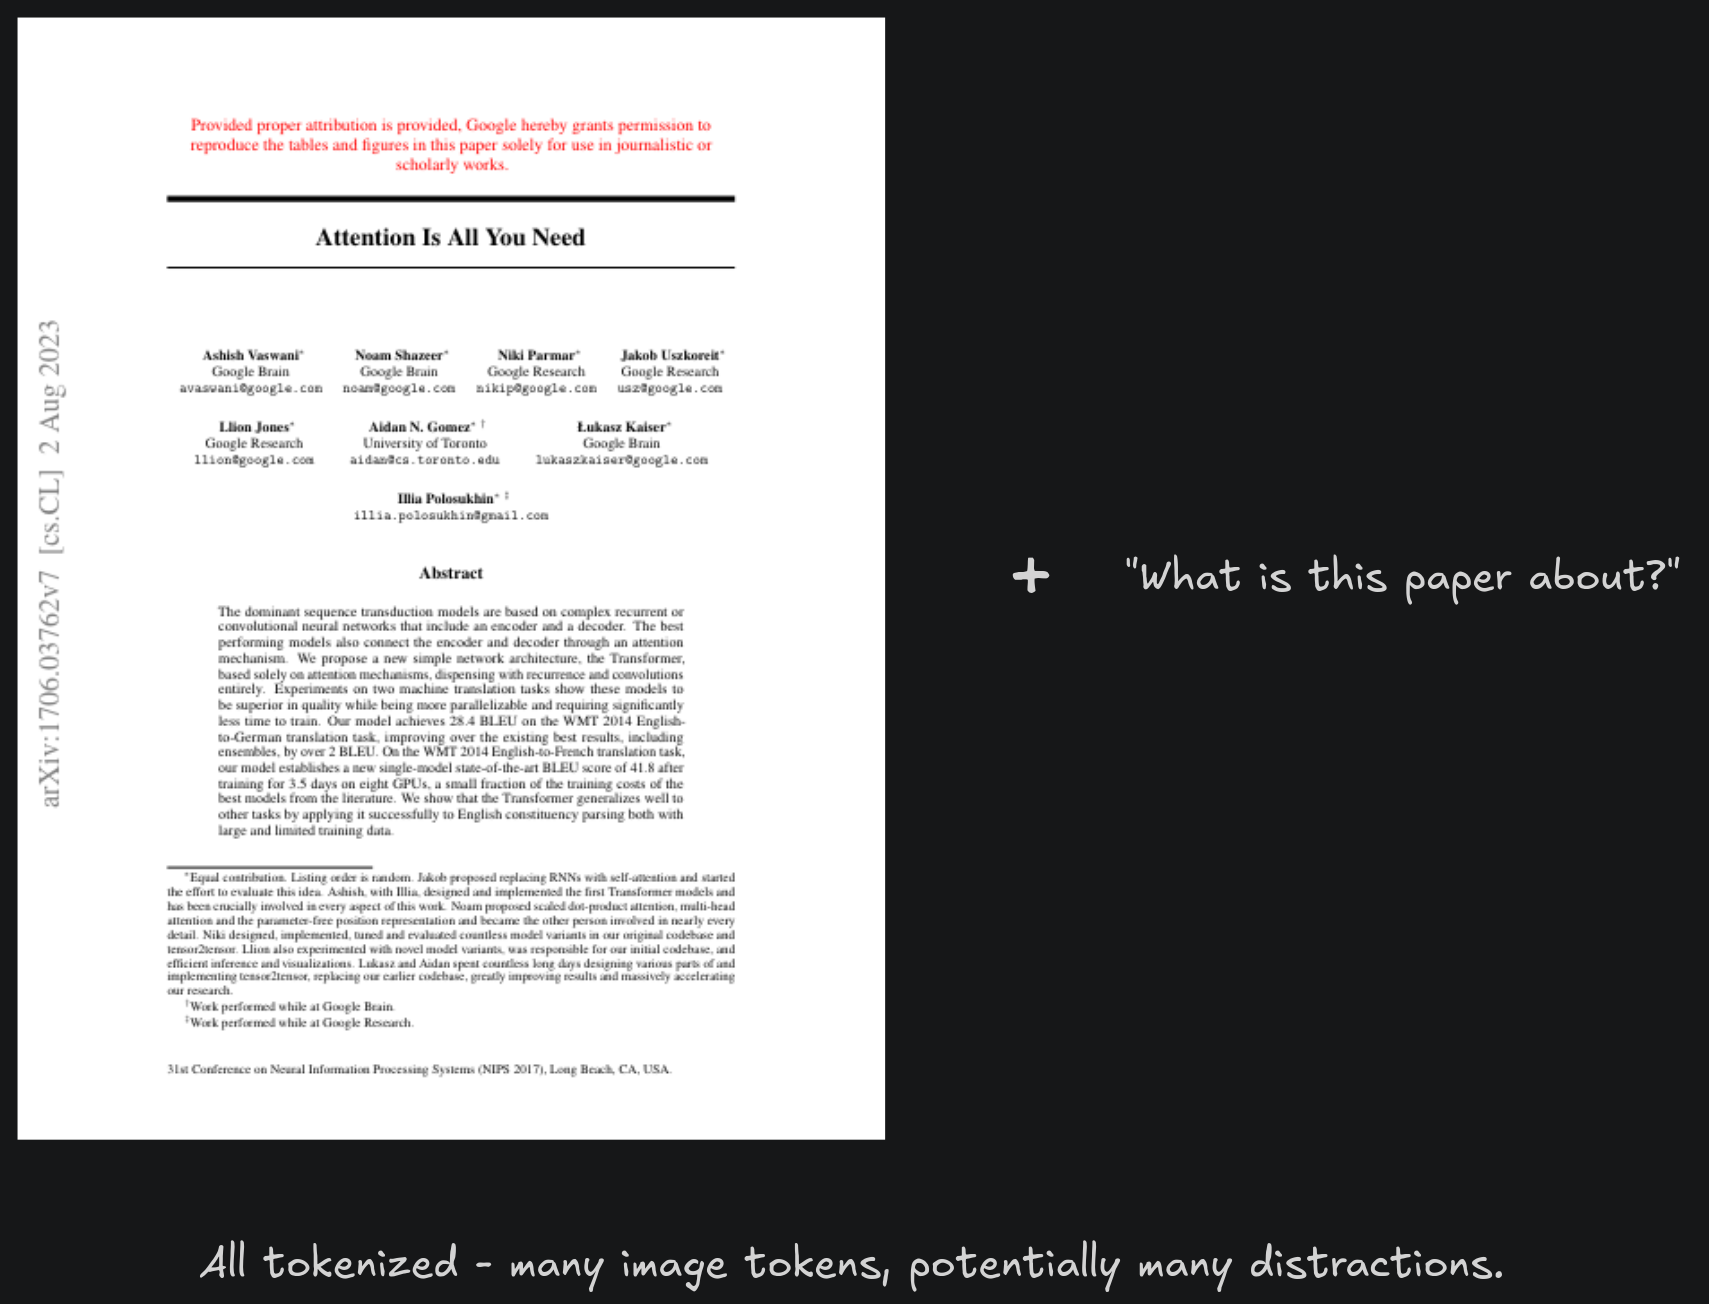
It’s worth mentioning that simple, single-page VQA is something that small language models can already excel at. But, you still pay a cost for:
- potentially distracting context
- wasted token spend
- non-auditable, you get the answer but not exactly where the information came from
As the number of pages grows, naturally so does your token cost. If you know that the answer might be spread across multiple pages, you must either:
- pack each page into a single call. Anecdotally, you can’t really win here, since smaller models perform worse as the number of pages increases, and larger frontier models that are actually able to handle multiple pages in a single call are slow and expensive.
- fan out with k-pages in each call to extract evidence, then pass that evidence along to a second model that synthesizes the answer. Here you’re still paying the same token cost, but you can get away with a smaller model. It’s also very slow.
What would be convenient here is to have a quick way to capture only regions that are relevant to your queries across pages using a small, local model. Now, you can send only a handful of useful crops downstream. A small language model can handle this focused information better than the whole pages from which they came, at a lower latency and token cost, and with artifacts that are easy to store and audit.
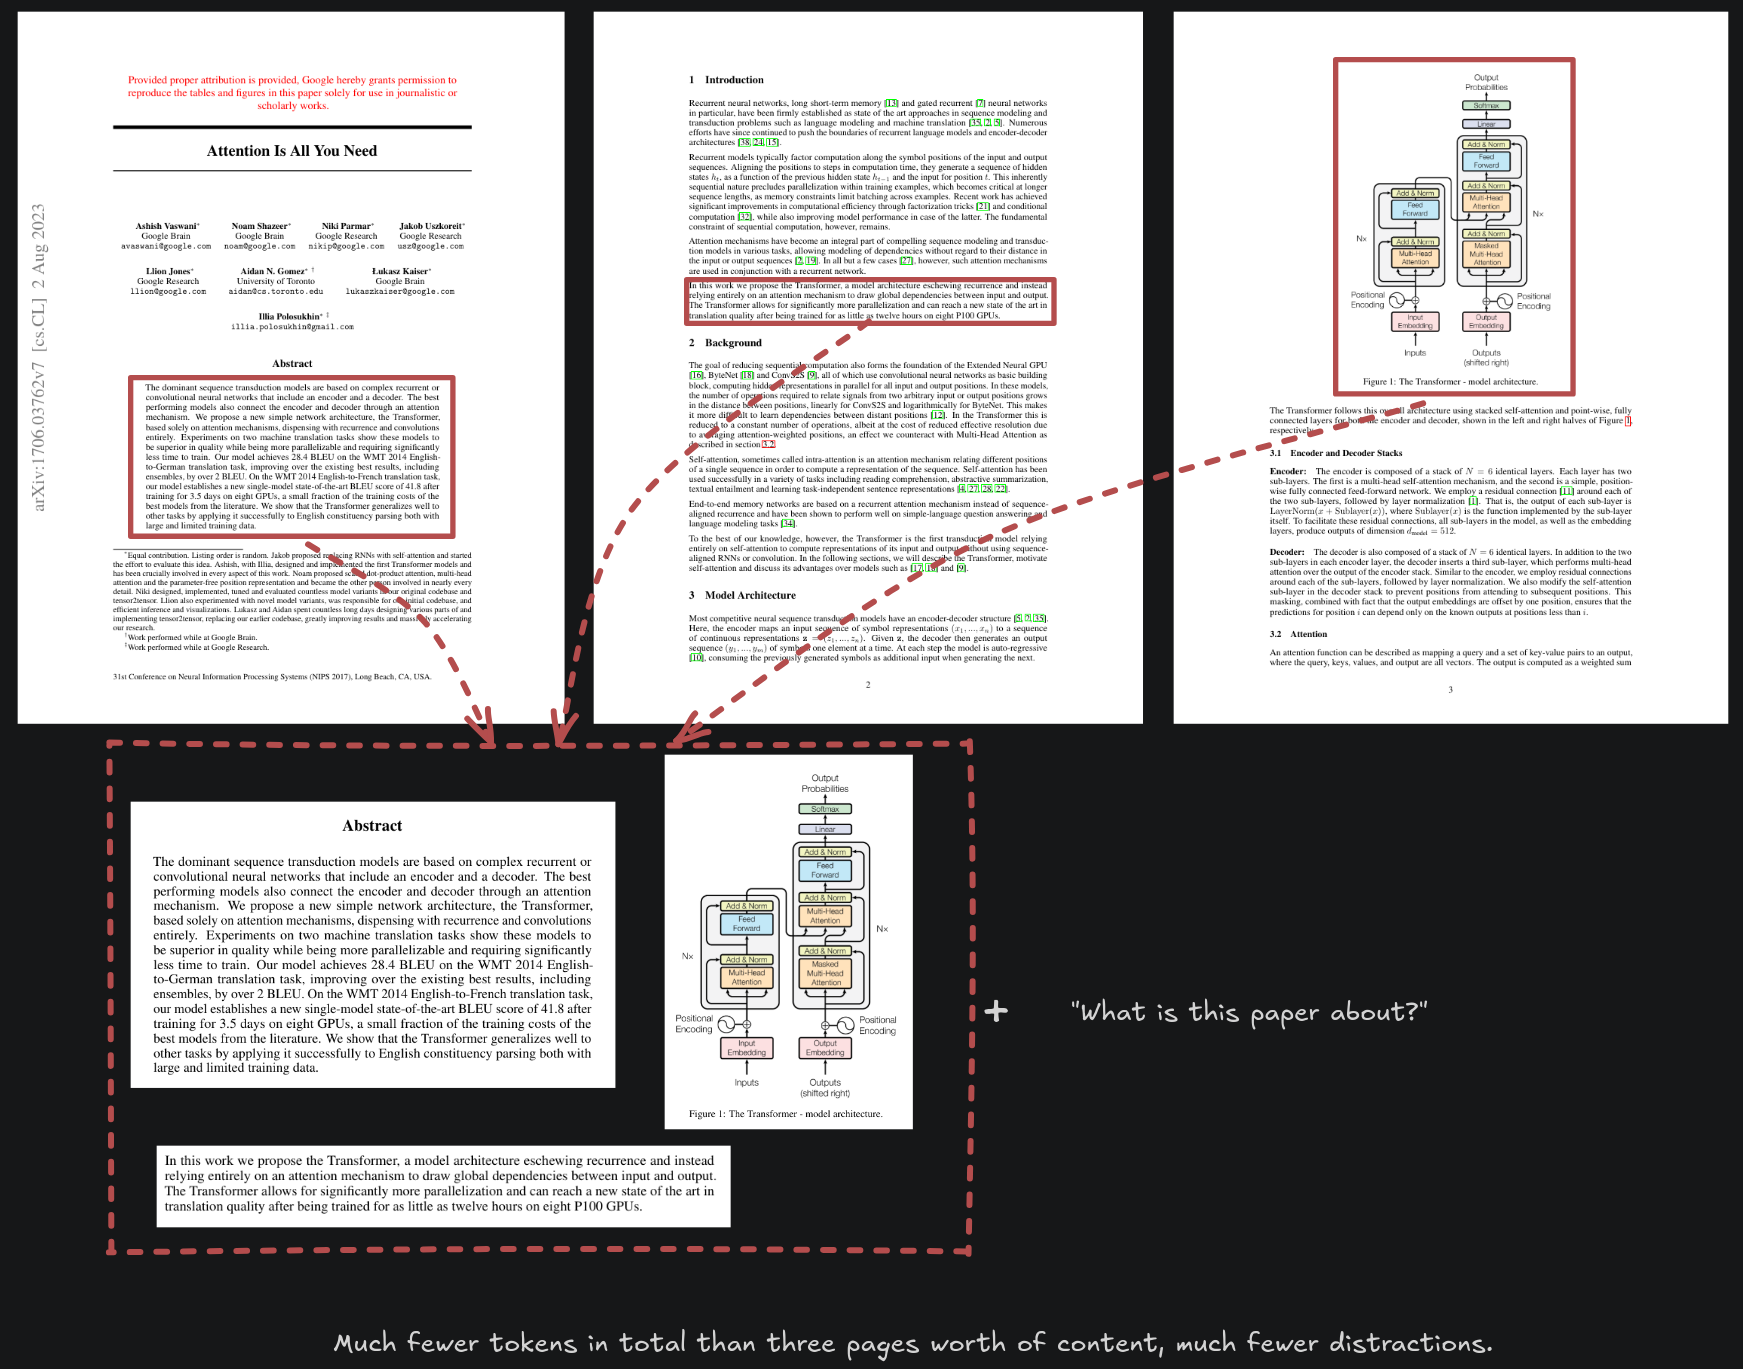
There are a number of ways in which you might extract these relevant regions, ie: run a layout detector first, then a small relevant/not-relevant classifier as a coarse filter, then feed crops into a local small language to gauge relevance. I want to try to condense as much of the pipeline into a single, relatively tiny model as possible.
Proof of Concept
For a PoC, the idea is:
- Take a small off the shelf model (I settled on
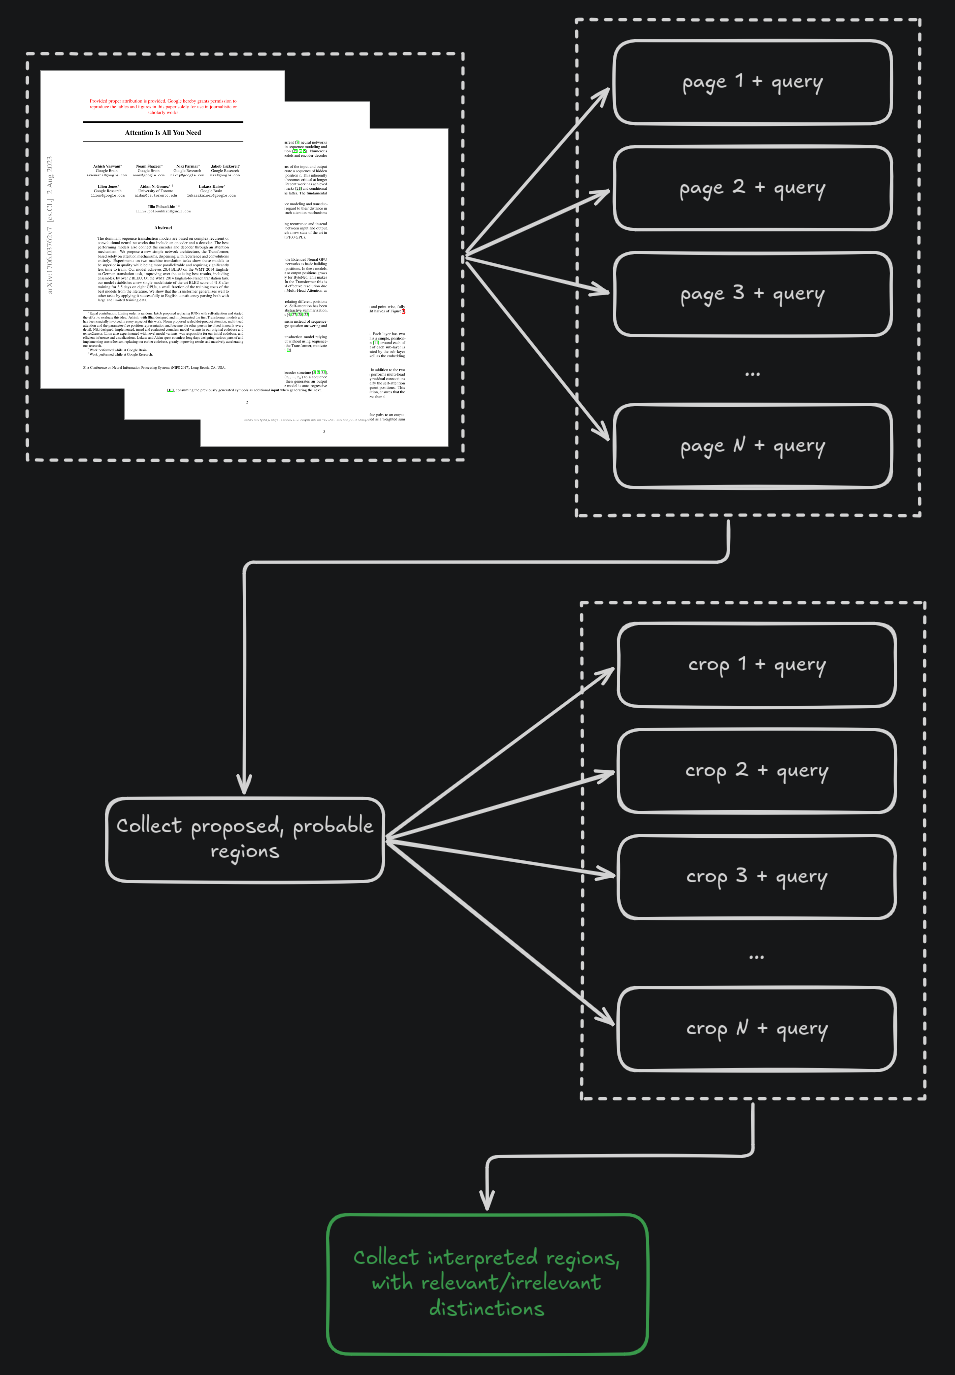
Qwen/Qwen3.5-0.8B) - Full fine tune to perform two functions: Find, which accurately locates probable regions that should be relevant to your query, this is optimized for recall, and Interpret, which looks only at these cropped regions in isolation along with the query, explaining why/why not the region is relevant. This acts as a filter, improving precision
- The crops can then be fed to a downstream VLM for answer synthesis, and are easy to audit
That looks something like this:
For a PoC, I’m really only concerned with establishing a baseline approach that seems to work decently in order to understand where to head next. Training data was synthetically generated from PubLayNet for no particular reason besides I had it on disk and it comes with regions out of the box. I generated 433,392 question+region pairs across 71,541 document pages. The model was fine tuned end to end on this data with randomly selected negative samples (question+irrelevant page/region pairs, randomly generated). Both tasks were trained jointly, upsampling “find” samples to account for the proportionally higher number of question+region “interpret” crops compared to their question+page “find” counterparts.
Eyeballed Eval and Results
Since training was done on PubLayNet, the model saw a lot of medical content and zero of anything else. To get a feel for how it generalizes, I ran it against a handful of out-of-distribution PDFs (papers, technical reports) sourced from Huggingface’s daily papers, and read through the full find/interpret trace for each. I picked four to show here, specifically for questions where the answer’s evidence was spread across multiple pages rather than sitting on one. Each link below is the full run: every page checked, every crop, and the model’s stated reasoning for keeping or discarding it.
Good — bdh_cq_in_context_learning (full report) Question: “What pass@2 score does the 150M-parameter configuration reach on ARC-AGI-1, and at what per-task inference cost?” The paper restates its own headline number (29.5% pass@2, ~$0.007/task) six times across the abstract, intro, results, and conclusion, in slightly different phrasing each time. The model correctly flagged all six.
Good — PMC5849940 (full report) Question: “How many infants worldwide were estimated to be exposed to maternal GBS colonization at delivery in 2015?” Unlike the example above, this isn’t a repeated sentence — it’s a genuinely distributed answer across multiple document pages. One page defines what’s being estimated, another states the total (16.4–27.0 million), and later pages break that same total down by region and outcome. No single page has the full picture. This is the case the iterative loop is actually for.
Bad — zetta_embodied_harness (full report) Question: “In Figure 7’s Goal-T6 transfer panel, what cumulative success rate is reached at the final (rightmost) round?” The model found the right panel, then kept going: it pattern-matched “success rate at final round” against three other, unrelated panels — Goal-S5, PnP-Stove, TurnOffStove — and marked all of them relevant too. Right shape (a line chart ending in a percentage), wrong content.
Bad — statem_terminal_bench_harness_scaling (full report) Question: “What kind of tasks is StateM intended for?” An open-ended question with no single located answer to sprawl across, so nearly every page that mentions StateM by name got pulled in as relevant, including a results table and a benchmark-cost figure that describe what StateM measured, not what it’s for. This one has the widest page-count of any example here, but it’s inflated sprawl, not real synthesis — worth contrasting directly against the two good examples above.
Conclusions & Thoughts
In general the results are decent for a <1B parameter model. There are some hiccups but that’s expected. I have some hunches that I want to test and some things I want to try next to put some polish on this, such as:
- right now, find runs on a relatively small image, resized to a max size of 800 pixels. The crops for interpret are taken from this same downsized image. I think that maybe if I were to crop from a higher resolution image, we might see fewer hallucinations
- the model stumbles on figures and tables sometimes, which makes sense. Spatial reasoning is hard for large models let alone one this tiny. Fixing this is probably not low hanging fruit, if it’s even possible for a model this small
- the dataset used to train the model was pretty simple: questions weren’t conceptual, and were usually directly grounded in some crop. It looks like the model heavily over-indexes on keywords because of this. The next iteration will be trained on more conceptual questions (ie: “What is this paper about?” instead of “What does the paper say about top-5 accuracy for model xyz?”)
- I wonder if we need find+interpret as separate steps at all… Maybe the model is able to do both in a single step, given a higher resolution image
- if find+interpret can be condensed into a single step, then maybe the model can handle answer synthesis as well, meaning no API call is necessary